
[UPDATE: We’ve updated our 2015 Community Snapshots to include 2015 ELA/Math Proficiency Data. Download the updated version for White Plains here.]
Today, we’re excited to release the 2015 White Plains Community Snapshot. The Community Snapshot series aims to give you a well-rounded picture of the environments that Westchester’s children are growing up in, from economics to education and demographics to health.
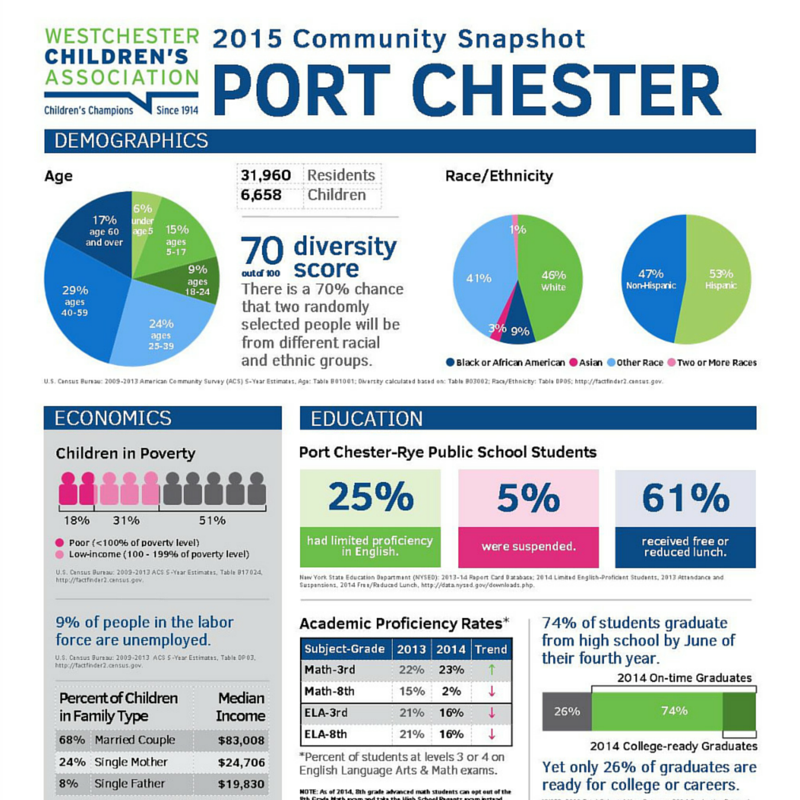
Be sure to view the snapshots for Yonkers, New Rochelle, and Mount Vernon. Community Snapshots for Ossining, Port Chester, and Peekskill will be released over the next few days.
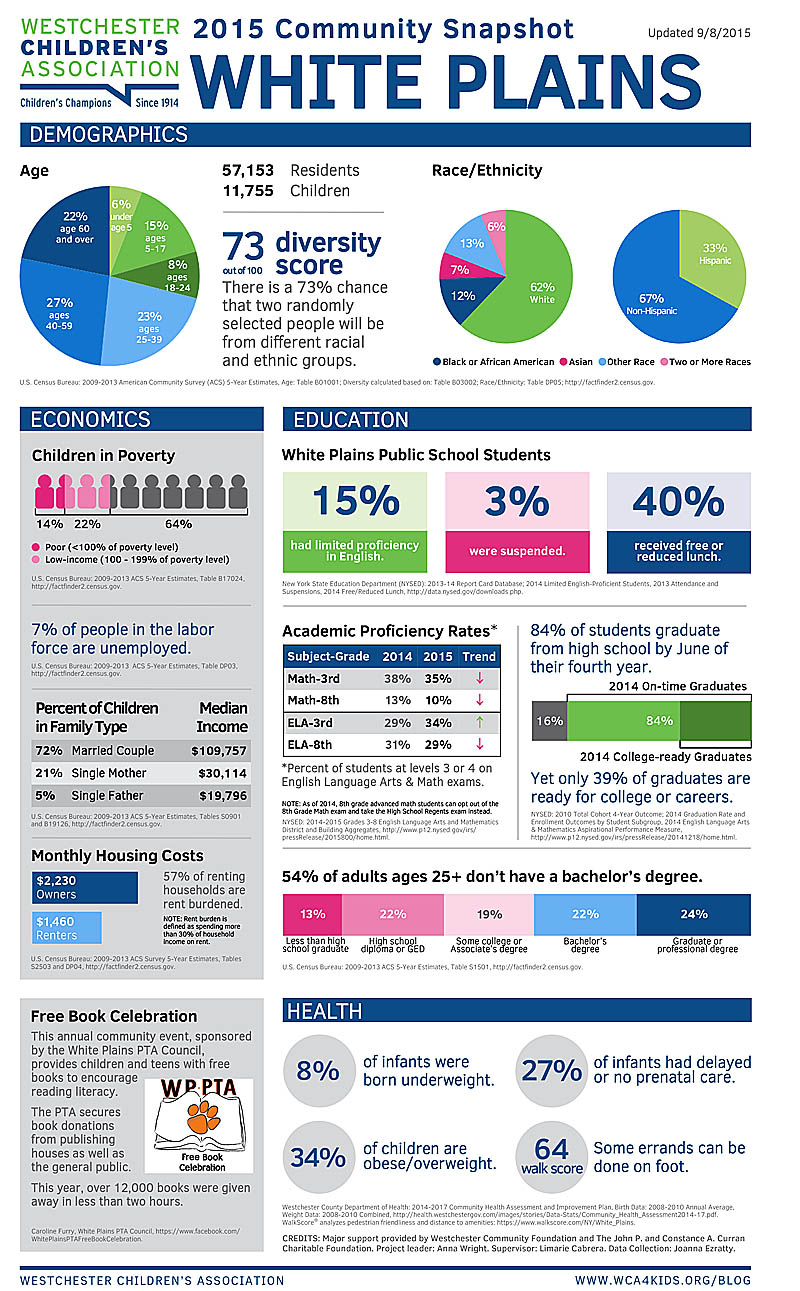
2015 White Plains Community Snapshot
A few interesting things to note about this year’s snapshot, especially in comparison to last year’s White Plains snapshot:
- White Plains experienced a significant drop in its walkability score — from 95 last year to 64 this year. We’re not sure if this is a reflection on changes within White Plains itself, or if walkscore.com made changes to the algorithm they use to calculate pedestrian friendliness. It is interesting, though, that none of the other four cities featured in last year’s inaugural Community Snapshot series experienced a similar drop in walkability.
- White Plains also witnessed several changes in the schools. The percentage of students receiving free or reduced lunch dropped from 53% to 40%. At the same time, academic proficiency rates fell in three out of the four categories featured. [UPDATE: This applies for the 2013 vs. 2014 comparison AND the 2014 vs. 2015 comparison. What increased? Between 2013 and 2014, the pass rate for Grade 3 Math went up by six percentage points. Then between 2014 and 2015, the pass rate for Grade 3 ELA went up by five percentage points.)
- In 2014, while the 8th grade Math proficiency rate declined dramatically, further investigation reveals that most of this decline was due to a new policy. As of 2014, eighth graders in advanced math classes are allowed to opt out of the 8th Grade Math exam and instead take the High School Regents Math exam. In 2013, 99% of the eighth grade class took the 8th Grade Math exam (498 of 502 eighth graders). In 2014, only 66% took the exam (348 of 522 eighth graders). [UPDATE: The low 8th grade Math proficiency rate in 2015 is most likely a reflection of the continuance of this policy.]
- At 7%, White Plains has the lowest unemployment rate out of the seven communities featured in the 2015 series. White Plains also has the lowest percentage of adults without a bachelor’s degree.
Download the 2015 White Plains Community Snapshot and its accompanying data packet. Enjoy!
You can still download the older version of the 2015 White Plains Community Snapshot and its accompanying data packet.
Pingback: 2015 Peekskill Community Snapshot - Westchester Children's Association
Pingback: 2015 Community Snapshots - Now with 2015 ELA/Math Data - Westchester Children's Association
Pingback: 2015 Port Chester Community Snapshot - Westchester Children's Association
Pingback: BONUS - 2015 Westchester County Community Snapshot - Westchester Children's Association
Pingback: 2015 Ossining Community Snapshot - Westchester Children's Association
Pingback: 2015 Mount Vernon Community Snapshot - Westchester Children's Association
Pingback: 2015 New Rochelle Community Snapshot - Westchester Children's Association
Pingback: 2015 Yonkers Community Snapshot - Westchester Children's Association