
Credits: Paul Overberg, USA TODAY Amanda Astey, Sarah Frostenson, Anthony DeBarros, Gannett Digital
We know that there’s a strong likelihood that this week’s Super Bowl and the aftermath of the most recent winter storm still predominate today’s conversation, but perhaps because of that, we wanted to highlight two reports that have recently come out about the diversity AND segregation that beleaguers communities in New York State.
Diverse but segregated
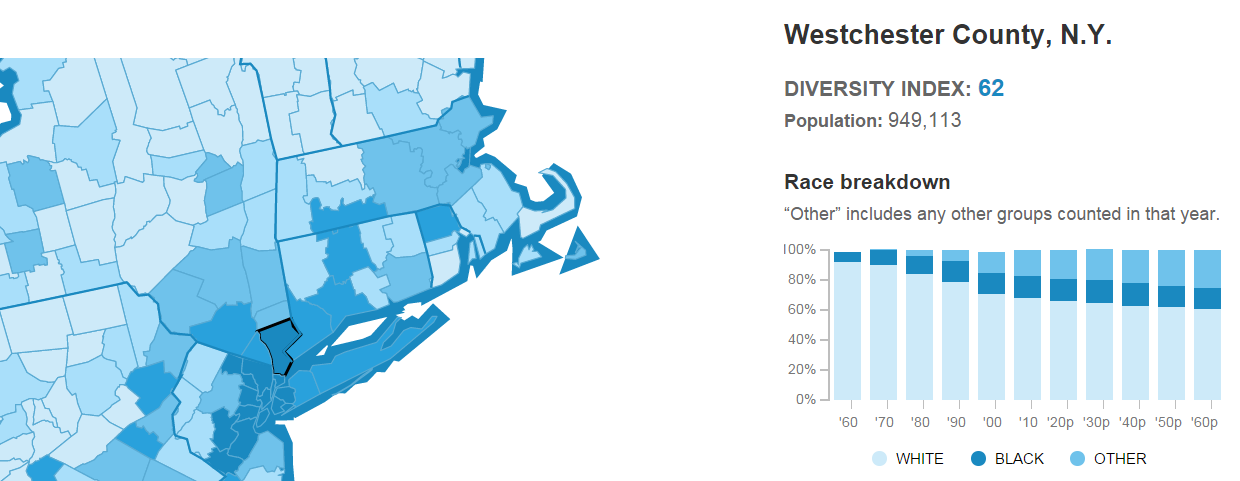
Back in October 2014, Dwight Worley reported on the changing demographic makeup of the lower Hudson Valley, in a LoHud/Journal News article titled New York more diverse, still segregated. Using a measure called the Diversity Index, which uses census data to determine the chance that two randomly chosen people within a given area are different by race or ethnicity, US counties were given a score of 0 to 100 to determine how diverse they were (Westchester’s Diversity Index is 62.)
“…over the next 50 years the Lower Hudson Valley will continue to attract greater numbers of blacks, Hispanics and Asians, building on an influx that has already reshaped the region’s cultural, political and economic landscape…. Westchester’s Diversity Index is expected to reach 71 in 50 years, making it look like today’s Manhattan.”
A significant part of the article is spent discussing how diversity statistics can mask continuing segregation across racial and ethnic lines in Westchester. NOTE: At the very bottom of the article, there is also a pretty nifty interactive map that shows the demographic data for all US counties from 1960 to the present, as well as projections up to 2060.
Assessing community risk
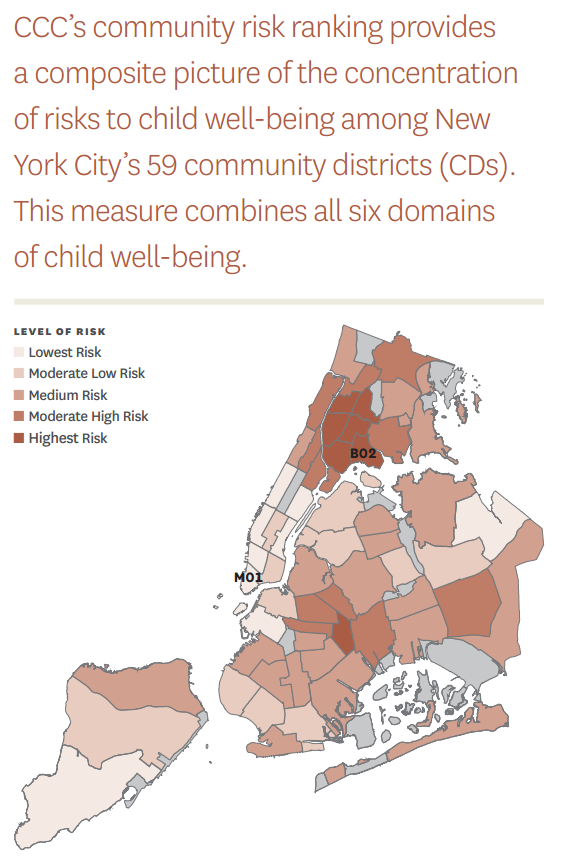
Credit: Citizens’ Committee for Children of New York
With that in mind, we reviewed a report just released this week by our counterparts at the Citizens’ Committee for Children of New York with particular interest. Using indicators from a number of areas (ex. economic, health, education), they assessed well-being of children across community districts in New York City, and ranked each community district accordingly.
As one reads the CCC Community Risk Ranking report, one is struck by the vast gaps in income and education that can occur in just a few city blocks. New York City becomes yet another demonstration of how diversity can mask segregation.
Their methodology of assessing communities is something for us to take note of, and although some of the indicators used to measure well-being would not work for our county due to statistical reasons, this could theoretically be applied across Westchester as well.
If you would like to see a similar “community risk ranking” for Westchester County, leave a comment expressing your interest.
A community risk ranking of Westchester communities would be most welcome. New York City data about housing, shelter population, poverty, etc. is easily available, much of it from NYC government. It would be useful to have more information about these indicators of well-being about our Westchester communities as well.