
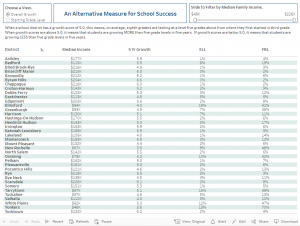
A new Stanford University study uses growth, as opposed to proficiency, to examine school district performance. At the local level, an initial look shows that more affluent school districts tend to have higher growth scores. However, two school districts, White Plains and Tarrytown, show relatively higher educational growth scores even though socioeconomic data would suggest otherwise.
EDUCATIONAL GROWTH DATA DASHBOARD
Click the image to access the data!
Just HOW do you measure the quality of a school?
This question is more important than ever as we witness dramatic shifts in the job market. Automation threatens the existence of entire job sectors – will self-driving cars replace taxi drivers? Will drones replace the delivery people that seem to be everywhere this holiday season? Although robot-proofing a career seems to be a daunting proposition, one thing is clear – the human mind remains a valuable commodity. The ability to handle unpredictable situations and to creatively utilize information on the fly is an ability that will continue to remain relevant in the upcoming decades.
In New York State, educators, parents and other decision makers have long looked at NY State’s annual ELA and Math proficiency scores as a measure of quality. However, one can argue, and many do, that merely looking at average test scores is not enough to fully assess school performance. School districts with significant low-income, first-generation American, and/or minority students are more likely to have children starting their scholastic career with less academic knowledge than school districts that serve a more affluent, established population. Comparing one school district’s average test scores against another makes the presumption that the starting line is the same for all school districts, when in reality, starting line placement is determined by factors such as poverty, adult education level, and English language acquisition, which are beyond a school administration’s control.
Measuring Growth
Which is why a report recently released by Stanford University recently garnered some attention from the New York Times. Stanford researcher, Sean Reardon, looked nationwide at Grades 3 through 8 standardized test scores, converted those scores to grade-level equivalents, and used those equivalents to come up with a growth measure that could be broken down by school district AND by race (breakdowns by gender and economic status are promised in later data releases.). He also looked at socioeconomic data from the American Community Survey’s School District Demographic System (SDDS) (2006-10 data) to see if factors outside the school played a part in children’s growth.
This growth measure is attached to grade levels. One would expect that a child who spends five years in school would achieve a level of proficiency that would be at minimum the equivalent of five grade levels. So if a child was tested at third grade, they would be at a third grade level (3.0), and when that child was tested again in eighth grade, that child would be at an eighth grade level (8.0). That child’s growth “score” would be 5.0 (8.0 – 3.0 = 5.0).
When a school district has a growth score of 5.0, this means, on average, eighth graders are testing at a level five grades above from where they first started in third grade. When growth scores are above 5.0, it means that students are growing MORE than five grade levels in five years. If growth scores are below 5.0, it means that students are growing LESS than five grade levels in five years.
One must remember high growth rates does not readily translate to high proficiency scores in the ELA/Math state tests. If children are coming in with less academic knowledge as they enter school, higher growth rates may not be enough for children to “catch up” to grade level. If anything, this underscores the need to also pay attention to early education efforts – when children start school at an advantage, educational success becomes much more attainable.
At the Westchester Level
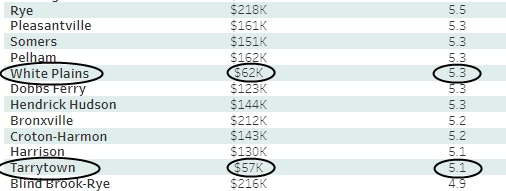
It becomes clear when we look at the local data that there is a relationship between a district’s socioeconomic status and a school district’s growth score. We observe that school districts with higher median family incomes generally also have higher growth scores. However, two school districts in Westchester buck that trend: White Plains and Tarrytown. [Disclosure: as a parent with a child in the White Plains school district, this pleased me immensely.] Despite the fact that they have median family incomes that are in the five-figure range, they are reflecting growth scores that would normally be associated with school districts that have six-figure family incomes. However, White Plains and Tarrytown continue to remain at the lower end of the spectrum when it comes to third grade ELA and math scores. Even though their growth scores are higher, children in those districts start at lower levels of proficiency compared to the rest of Westchester.
At this point in time, we don’t have any idea why these districts rise above the crowd. What is the “secret sauce” fueling children’s growth in these two districts, or any other district for that matter? Sean Reardon himself states, “Other characteristics of communities, including family resources, after school programs, and neighborhood conditions may all affect growth in test scores independent of schools’ effects.” ( (2017). Educational opportunity in early and middle childhood: Variation by place and age.) Further observation and analysis is required to draw any solid conclusions of what may be contributing to these growth rates.
After the holidays, we will continue to report on our findings (and we will be providing data broken down by race). An initial look into the local data reveals:
- There is a relationship between race and growth scores (which reflects the findings at the national level.)
- There is also a relationship between race and “the starting line”.
- When growth rates are measured by subject (ELA vs. Math), some interesting questions emerge.
- Student-Teacher ratio doesn’t seem to play a huge part in growth scores. The relationship is weak, at best.
The data can be found at https://cepa.stanford.edu/seda/data-archive.
Pingback: An Alternative Measure for School Success - Part Two