
 We often get questions from the field about the process that we use to collect, visualize, and disseminate data. So yesterday, Anna Wright, Sarah Yergeau, and I showed up bright and early at the Tarrytown Doubletree, fueled by multiple cups of coffee, a healthy dose of pre-presentation jitters, and hours of preparation, to present “Break Through with Data” at the 2015 United Way Not-For-Profit Leadership Summit XIII. We had an incredible audience, and it was wonderful to receive such positive feedback.
The official description, more or less?
“Do you want to build credibility with funders, partners and the general public? Do you want to increase engagement with your audience as you seek to accomplish your agency’s mission? Learn from Westchester Children’s Association’s experience using data to get their message across.
We will discuss how to:
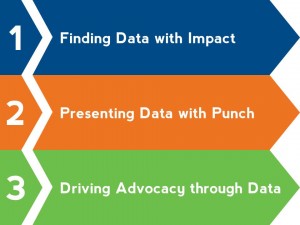
- identify data with maximum impact,
- transform that data into something approachable and appealing
- use that information to mobilize and engage child advocates.
We’ll share insights into particular data sources you can explore, online, free tools you can use to present data effectively and strategies for sharing your message with measurable results.
The unofficial recap
Indeed, we did cover all these things, but we also discussed these issues:
- how infographics can be used to manipulate an audience
- why data is meaningless without a story
- free and low-cost tools to build offline and online infographics
- mistakes that we’ve committed (yes, there were plenty of mea culpas here)
- reducing visual clutter (see the bullet point above)
- the power of social media to get the message across
- why shorter IS sweeter
So if you didn’t have the opportunity to watch us present, or even if you did, you can view the presentation slides in three parts below or download a pdf to peruse at your will. This one page handout lists the many data sources, tools, and references we use when we make an infographic that is accurate, concise, and powerful.
And as we said at yesterday’s presentation, please feel free to contact us via Facebook, Twitter, blog comments, or even good old fashioned e-mail, if you have any questions. Thank you to everyone who joined us for the workshop!