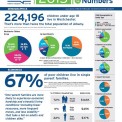
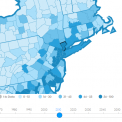
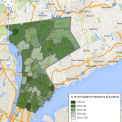
Our new 2015 Children By the Numbers data bulletin with key statistics about children and youth in Westchester County is now available for download! Back by popular demand, this updated six page graphic report highlights the most current information on: Demographics, Economics, Education, Youth and Young Adults, Health, and Child Welfare. Read More & Comment
Archives
Two Reports – Same Story
We know that there’s a strong likelihood that this week’s Super Bowl and the aftermath of the most recent winter storm still predominate today’s conversation, but perhaps because of that, we wanted to highlight two reports that have recently come out about … Read More & Comment
2014 Candidate Survey on Children’s Issues
Our children bring us together, regardless of party & ideology. Each election, our VOTE for KIDS initiative surveys candidates on their opinions regarding issues affecting Westchester’s children and youth. WCA does not support or oppose any candidate for public office. … Read More & Comment
2014 ELA and Math Proficiency Rates
Last week, we announced the release of the 2014 test score results for English Language Arts (ELA) and Math proficiency rates. Since our initial blog post, we’ve had more time to look at the data in greater detail. Today we’re sharing … Read More & Comment
New KWIC Mapping Tool
We’ve already shared about the useful resources at NYS KWIC (Kids Well-being Indicators Clearinghouse), but we’re excited to share that even more data on children is now available from this handy site. You can now find relevant data at a larger number … Read More & Comment
Graduating Ready for College: Racial Disparities
In continuation of our discussion of the new graduation and college readiness data from the New York State Department of Education, today we’d like to share an interactive map with you. If you’ve missed our previous posts, be sure to catch up on the conversation … Read More & Comment
District Comparisons: Graduation and College Readiness Rates
Today we have two different infographics to share with you as we continue our discussion of the latest graduation and college readiness data from the New York State Department of Education. We’ve already discussed some of our findings in a previous blog post, but promised … Read More & Comment
Maternal and Infant Well-Being
This interactive map shows: Birth Rate by Municipality for the years 2006-2009 the percentage of mothers that received delayed prenatal care, which means either prenatal care starting in the second or third trimester or no prenatal care at all) age … Read More & Comment