
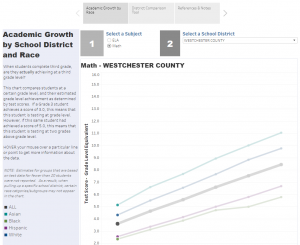
Click to use dashboard (best viewed on a non-mobile device).
Viewing Educational Growth Data through a Racial Lens – What’s the Point?
I always feel a little hesitant when presenting data through a racial lens. There are times when I ask myself: What is the point of this whole exercise? Are we merely retelling the same stories? And WHY are we retelling the same stories? Children of color face lower educational outcomes. Certain school districts in Westchester are struggling. After all these years, race is STILL a systematic challenge. The data shows a system that continues to stack the deck against people of color.
We must always be aware that data, especially test score data, demonstrates what has happened in the past. It is easy to use past information to resign ourselves to the same future. It is not so easy to use past information to challenge us into creating a better future for our children.
It is with this intention that we continue our analysis of the Stanford SEDA data set, released in December 2017. As we alluded to in our first post, we saw a relationship between academic growth and race. When we plotted estimated average Math achievement scores by race and by grade – this is what we saw:
| Race | Grade 3 | Grade 8 | Growth |
| Asian | 5.1 | 11.0 | 5.9 |
| Black | 2.3 | 5.6 | 3.3 |
| Hispanic | 2.5 | 6.7 | 4.2 |
| White | 4.3 | 9.8 | 5.5 |
Black and Hispanic children not only start lower as they begin their academic career, but they also have lower rates of growth as they move from elementary to middle school.
Something else caught our eye when we looked at the Math scores.
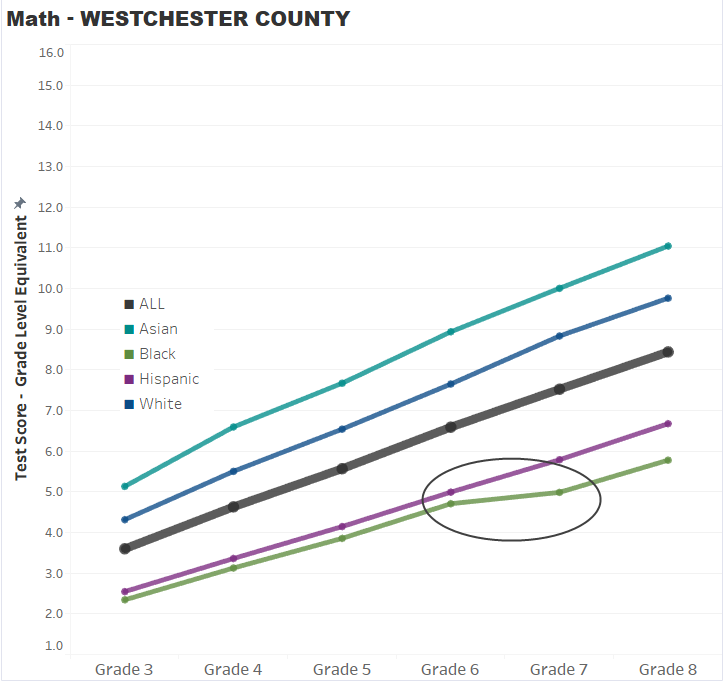
We noticed for Black students, there was a pronounced “flattening out” of growth between Grades 6 and 7. Indeed, in Grades 6 and 7, Asian and White students continue to achieve 1.1 grade levels of growth in one academic school year. However, Black and Hispanic students experience growth levels that have the equivalent of LESS THAN A GRADE in the same time period.
| Race | Grade 6 | Grade 7 | Growth |
| Asian | 8.9 | 10.0 | 1.1 |
| Black | 4.7 | 5.0 | 0.3 |
| Hispanic | 5.0 | 5.8 | 0.8 |
| White | 7.7 | 8.8 | 1.1 |
As you look through the data dashboard and find other trends, keep in mind:
- School growth rates, as we discussed in Part I, vary widely by district. This unfortunately underscores the fact that in Westchester County, race and zip code still play a major part in determining opportunity.
- In Westchester County, the “spread” in average scores across racial subgroups is much wider when testing for Math as opposed to ELA.
- When you view the data grade by grade, keep in mind there are other factors, in addition to actual school performance, that may play a part in the reflected scores . Children may move from the public school system to the private school system. Parents may decide to have their children opt out of state testing. What you see isn’t necessarily what you get.
The challenge thrown at us: How do we provide children equal opportunity for growth, given the inequality we see before us? Initiatives, such as our own GPS4Kids and Westchester’s participation in the national My Brothers’ Keeper effort start with understanding the systemic power of institutional racism, but nevertheless accept the challenge, and are seeking to discover and implement solutions to this inequity. But at the end of the day, it is up to all of us to stay alert, stay the course, and keep our eyes on the prize: to provide ALL our children the chance to survive and thrive.
Staff members Erica Ayala, Denise Killeen, and Allison Lake also provided significant contributions to this post and the dashboard.
SO JUST HOW DID WE CALCULATE THE SCORES?
To find out how Stanford calculated the data, you can read it HERE.
Utilizing Stanford’s SEDA_geodist_long_GCS_v20.csv file, we extracted out the school districts in Westchester County. To estimate scores by grade and subgroup, we took the averages calculated each school year for the specific grade and subgroup. We assigned a weight (Number of participating children in for each school year/grade/subgroup/subject divided by the total number of participating children for each grade/subgroup/subject) to each of those averages. We then calculated a weighted average to estimate the overall score for children in a particular grade/racial subgroup/subject. Please be aware that by using averages to arrive at an estimated score for all children in a particular racial subgroup and grade as opposed to using individual level data may create different results, especially since Stanford SEDA suppressed averages if the number of children in each year/grade/racial group was less than 20 or if the participation these groups were less than 95%. This is a particular issue when estimating school district level estimates (Westchester County estimates do not encounter the same suppression.)
The Westchester County scores also reflect students in Special Act School Districts, who are in grades 7 and 8. However, these children are a just a small percentage of the Grade 7 and 8 population, and should not impact the Westchester County estimates significantly.
R code is available upon request.